
 AsyaTicari
 AsyaRestoran
 AsyaOtel
 AsyaCrm
 AsyaKlinik
 AsyaSpor
 AsyaSSH
 AsyaEmlak
 AsyaFilo
 AsyaPuantaj
 AsyaİSG
 AsyaİHD
 Kolay Öğren
AsyaTicari · Reports
Reports
Sales, purchases, product sales, cash / bank, expenses, VAT summary, stock value, receivables and payables ageing; date range and Excel export.
This screen changed recently. Screenshots will be retaken after the code change of 2026-11-19; the text is current, some images may look outdated.
The Reports screen brings the business's nine basic reports together. Amounts are in TRY; every report can be exported to Excel.
Parts of the screen
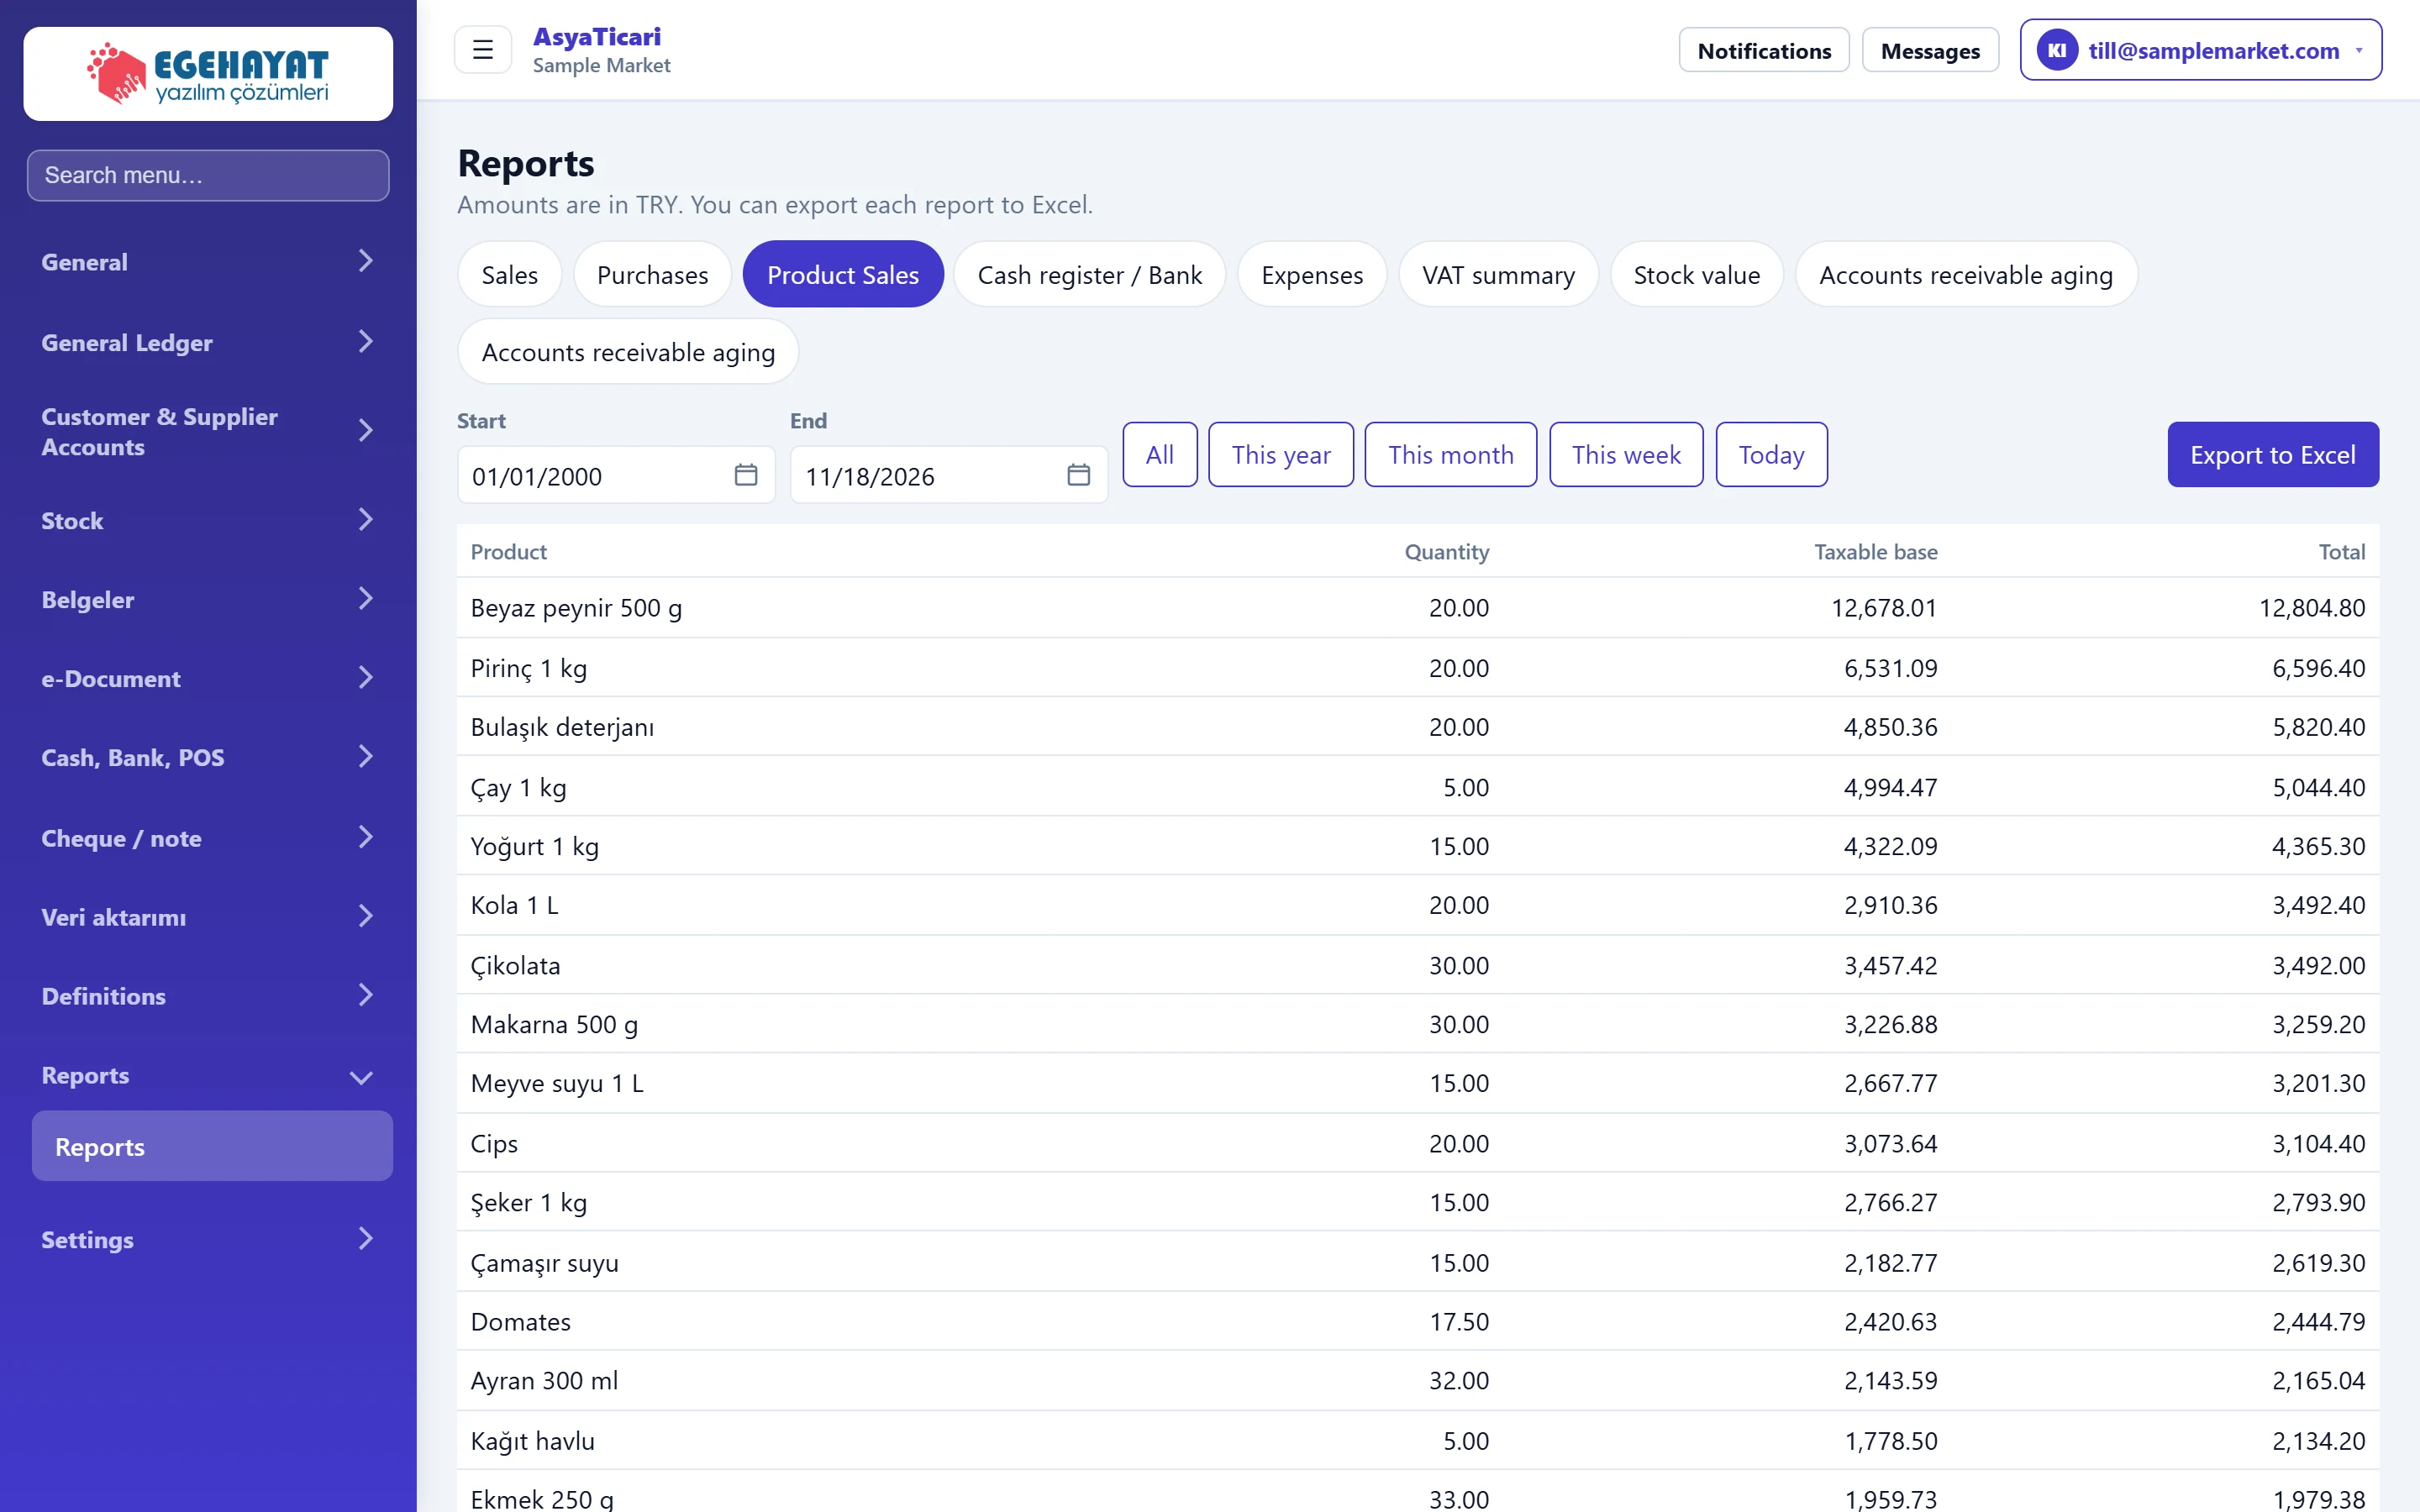
- 1Report tabs Nine reports: sales, purchases, products, cash / bank, expenses, VAT, stock value, receivables and payables ageing.
- 2Date range First and last day of the report.
- 3Quick range Preset ranges: all, this year, this month, this week, today.
- 4Export to Excel Downloads the table on screen as an Excel file.
- 5Report table Table; the bottom row totals the numeric columns.
| Tab | Contents | Date range |
|---|---|---|
| Sales | Sales documents: date, document type, document no., account, net, VAT, total, paid. | Yes |
| Purchases | Purchase documents with the same columns. | Yes |
| Product Sales | Quantity sold, net and total per product. | Yes |
| Cash / bank | For every cash, bank and POS account: opening, in, out, closing. | Yes |
| Expenses | Count and amount per expense type. | Yes |
| VAT summary | Sales / purchase base, output and input VAT and the difference per VAT rate. | Yes |
| Stock value | Code, product, unit, quantity, average cost, value, critical level. | No (current position) |
| Accounts receivable aging | Customer receivables not yet due and 1–30, 31–60, 61–90 and 90+ days overdue. | No |
| Payables ageing (the tab label also reads «Accounts receivable aging» in English) | The same bands for supplier payables. | No |
The bottom row of every table totals the numeric columns (except columns that cannot be added, such as quantity and average cost).
Date and export

- 1All All records from 2000 to today.
- 2Today Only today (selected when the screen opens).
- 3Export to Excel Disabled while the table is empty.
| Field | Sign in | Description |
|---|---|---|
| Start | Text | First day of the report. Changing it refreshes the report immediately. Placeholder: «mm/dd/yyyy» |
| End | Text | Last day of the report. Placeholder: «mm/dd/yyyy» |
Preset range buttons: All, This year, This month, This week (Monday to today), Today. The range is today when the screen opens. Export to Excel downloads the table on screen; the file name contains the report and date range. The button is disabled while the table is empty.
VAT summary
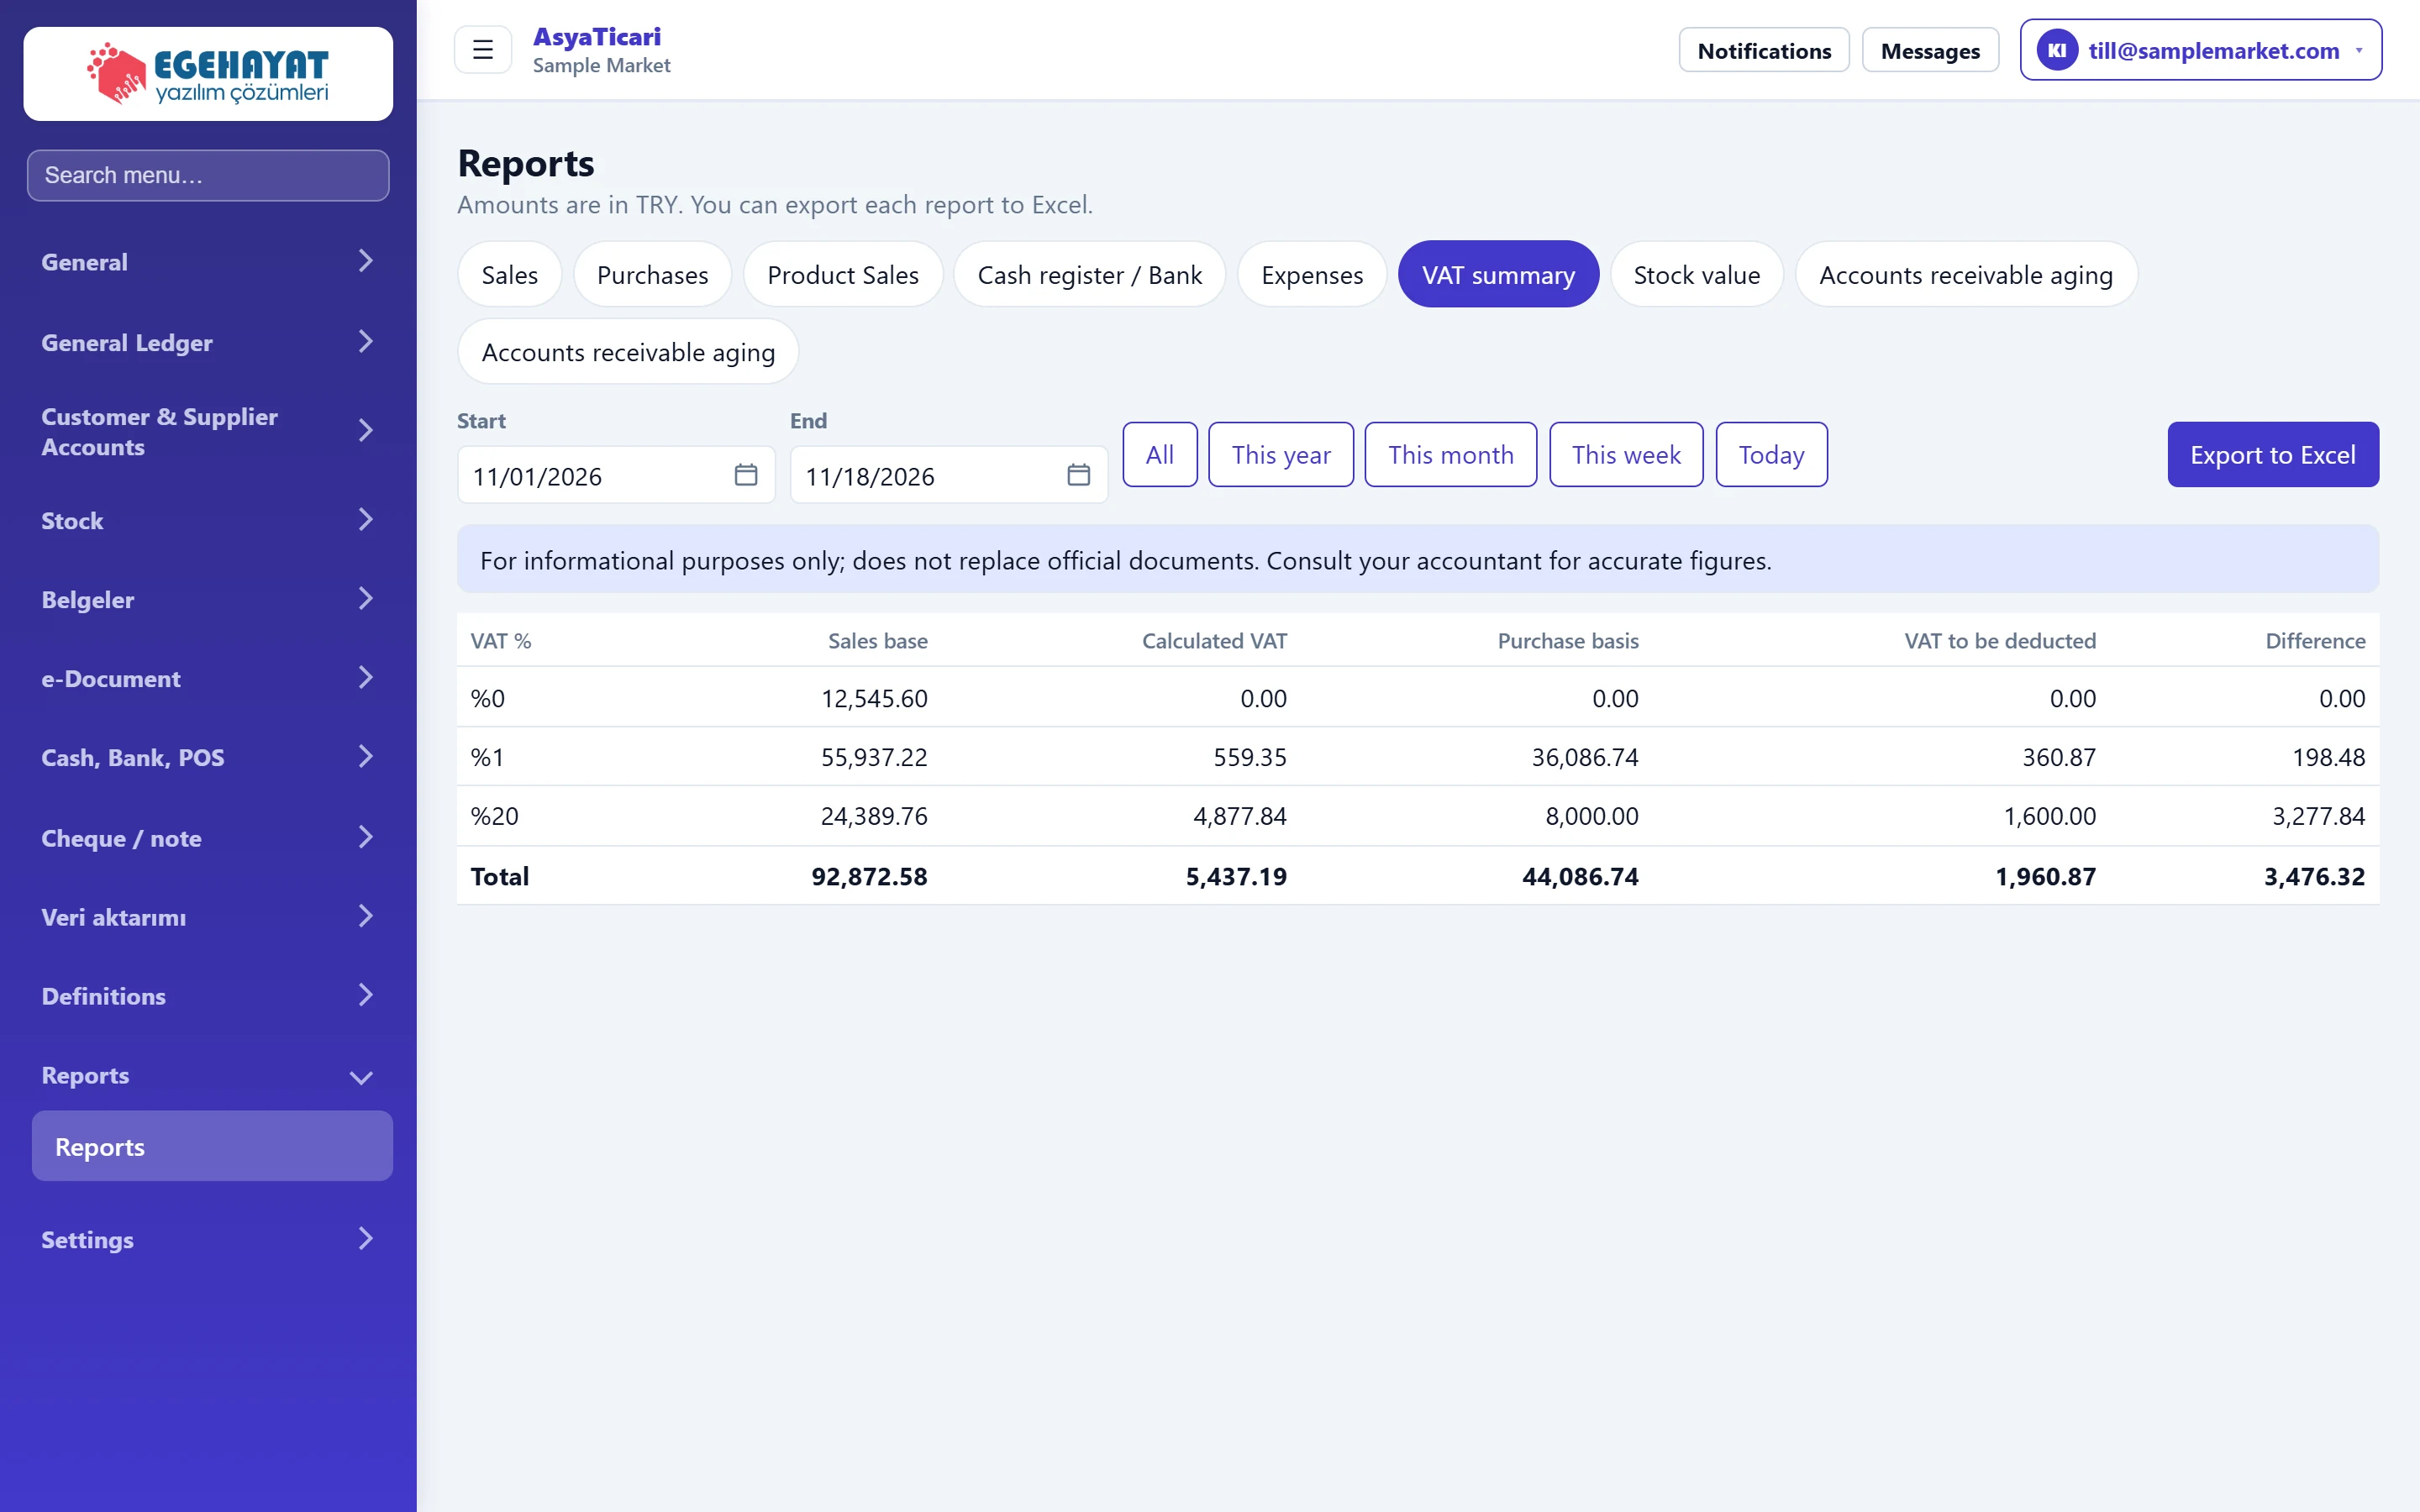
- 1Warning The report is for information only; it does not replace the tax return.
- 2VAT rates Sales and purchase base, output and input VAT and the difference by VAT rate.
The VAT summary is for information only; it does not replace the tax return. Consult your accountant for exact amounts.
Cash / bank
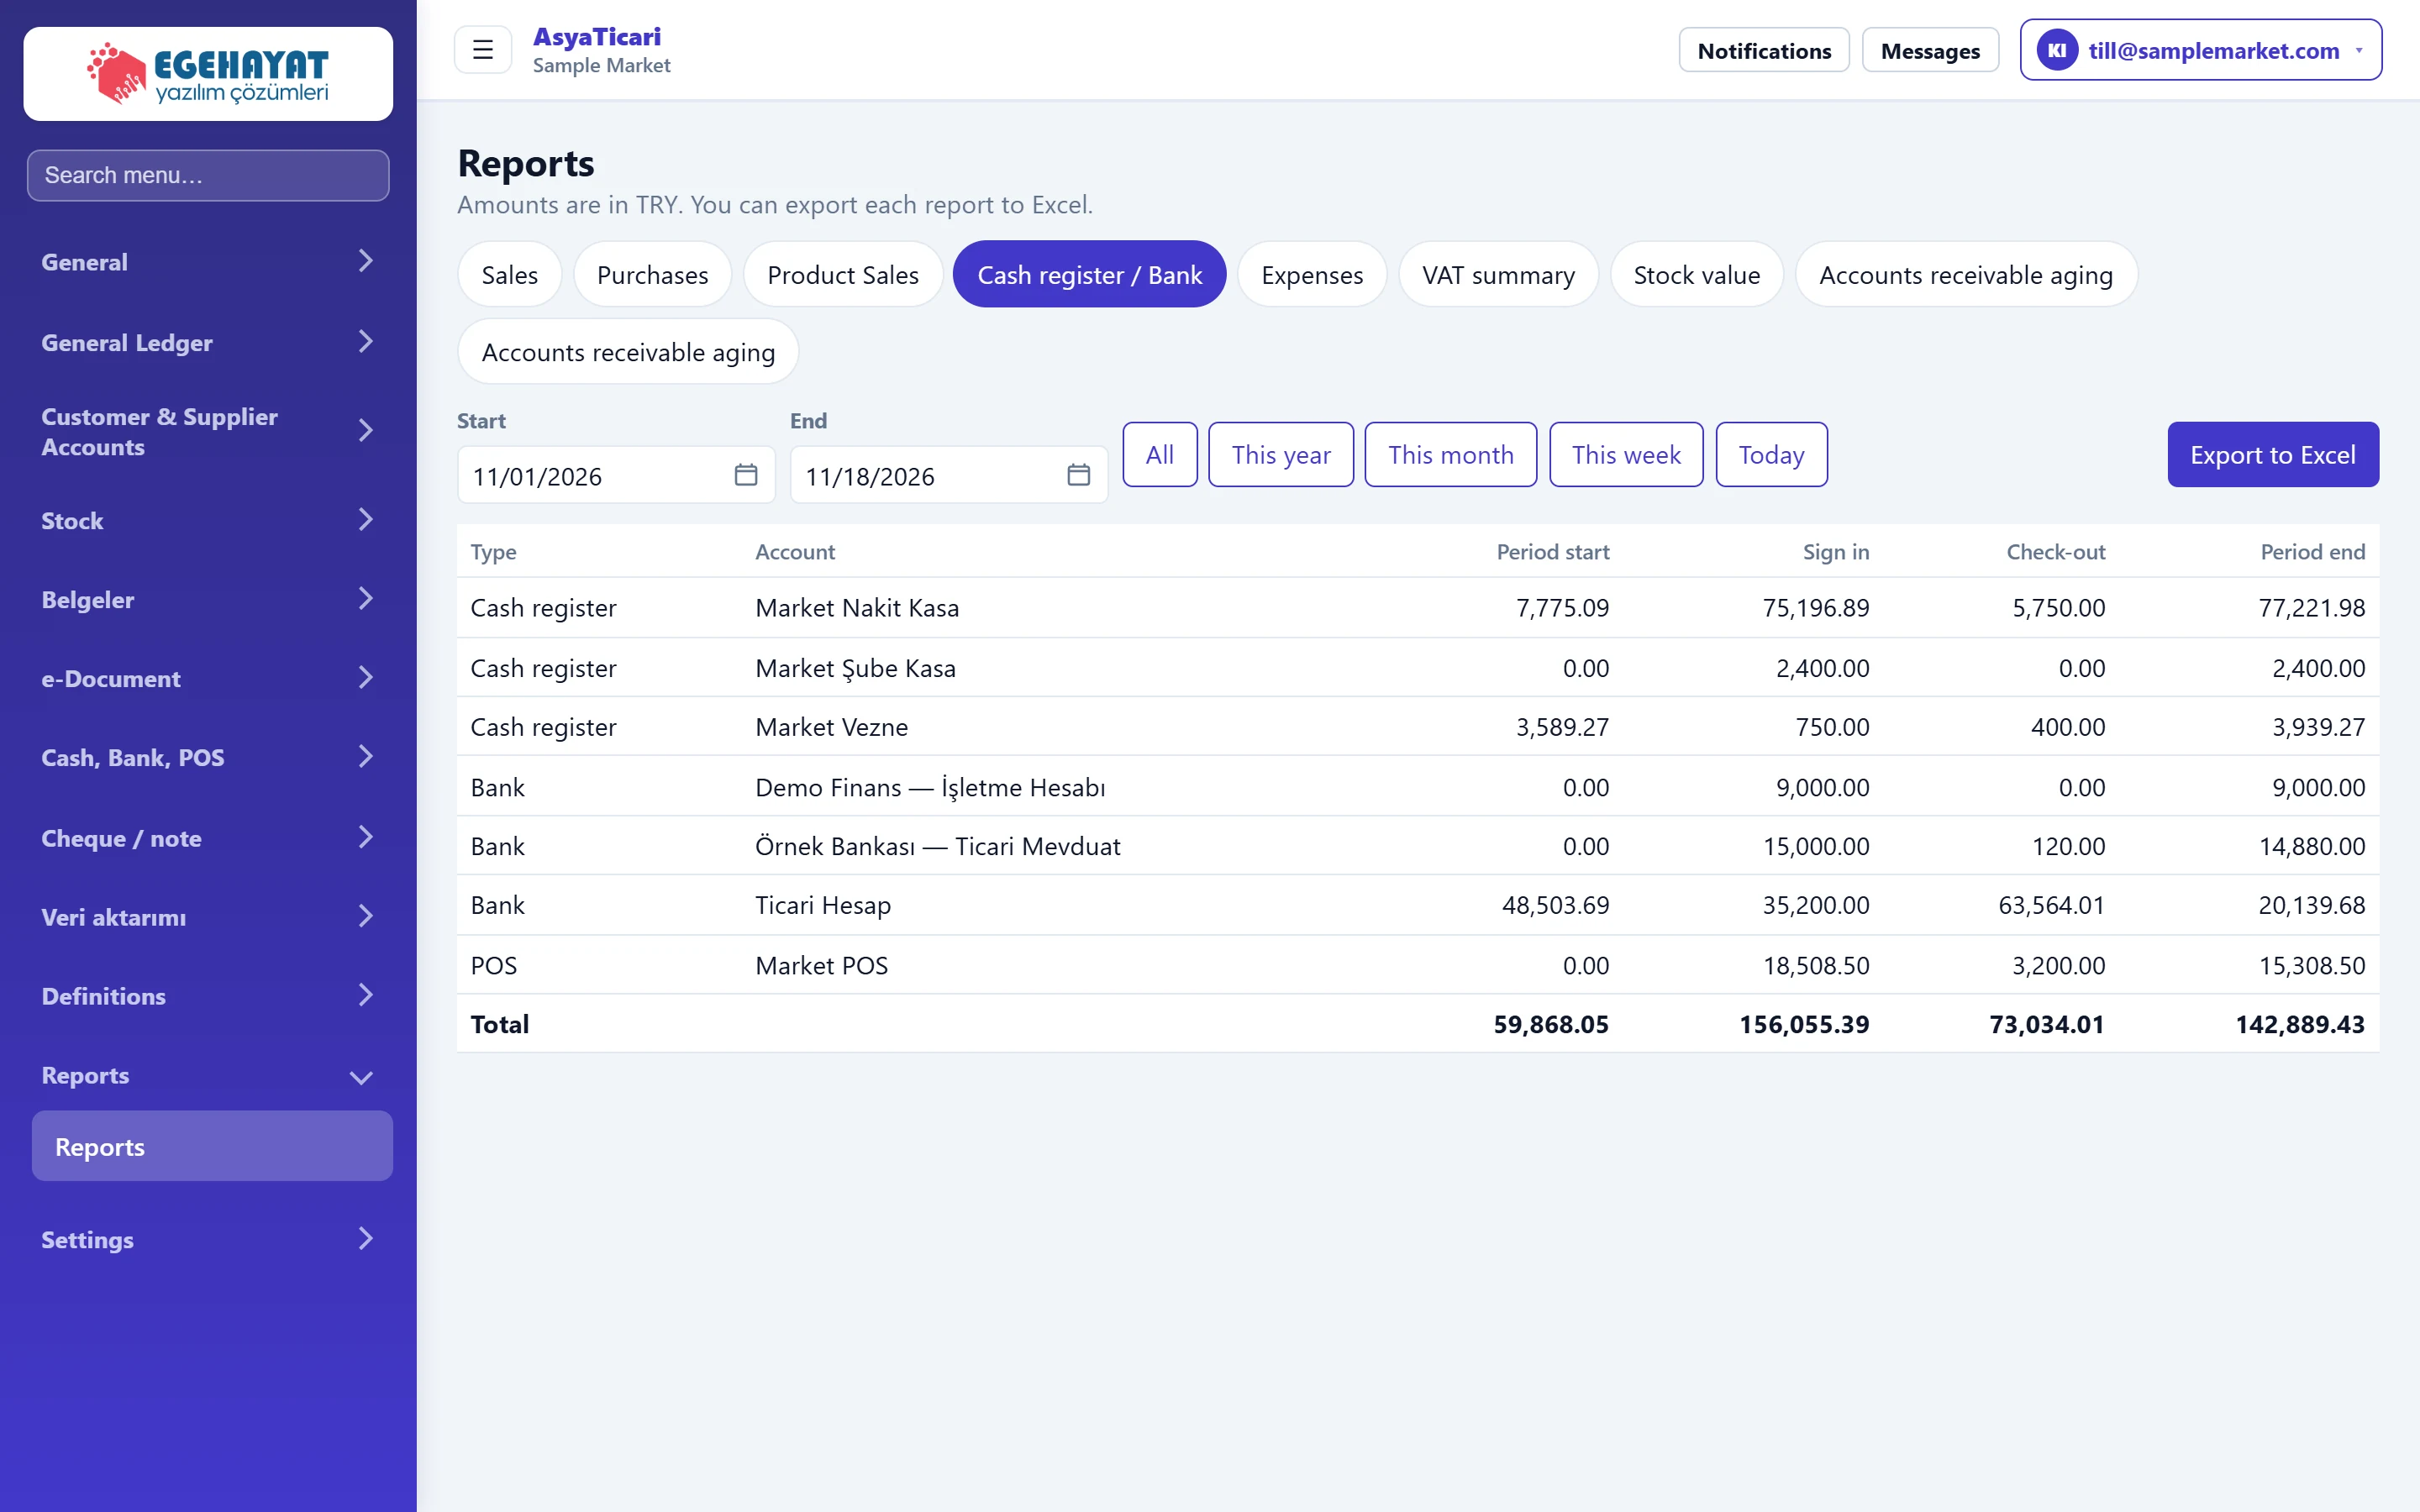
- 1Opening Balance at the start of the selected range.
- 2Closing Balance at the end of the range.
Closing = opening + in − out. To compare with a cash count, set the range to a single day.
Receivables ageing
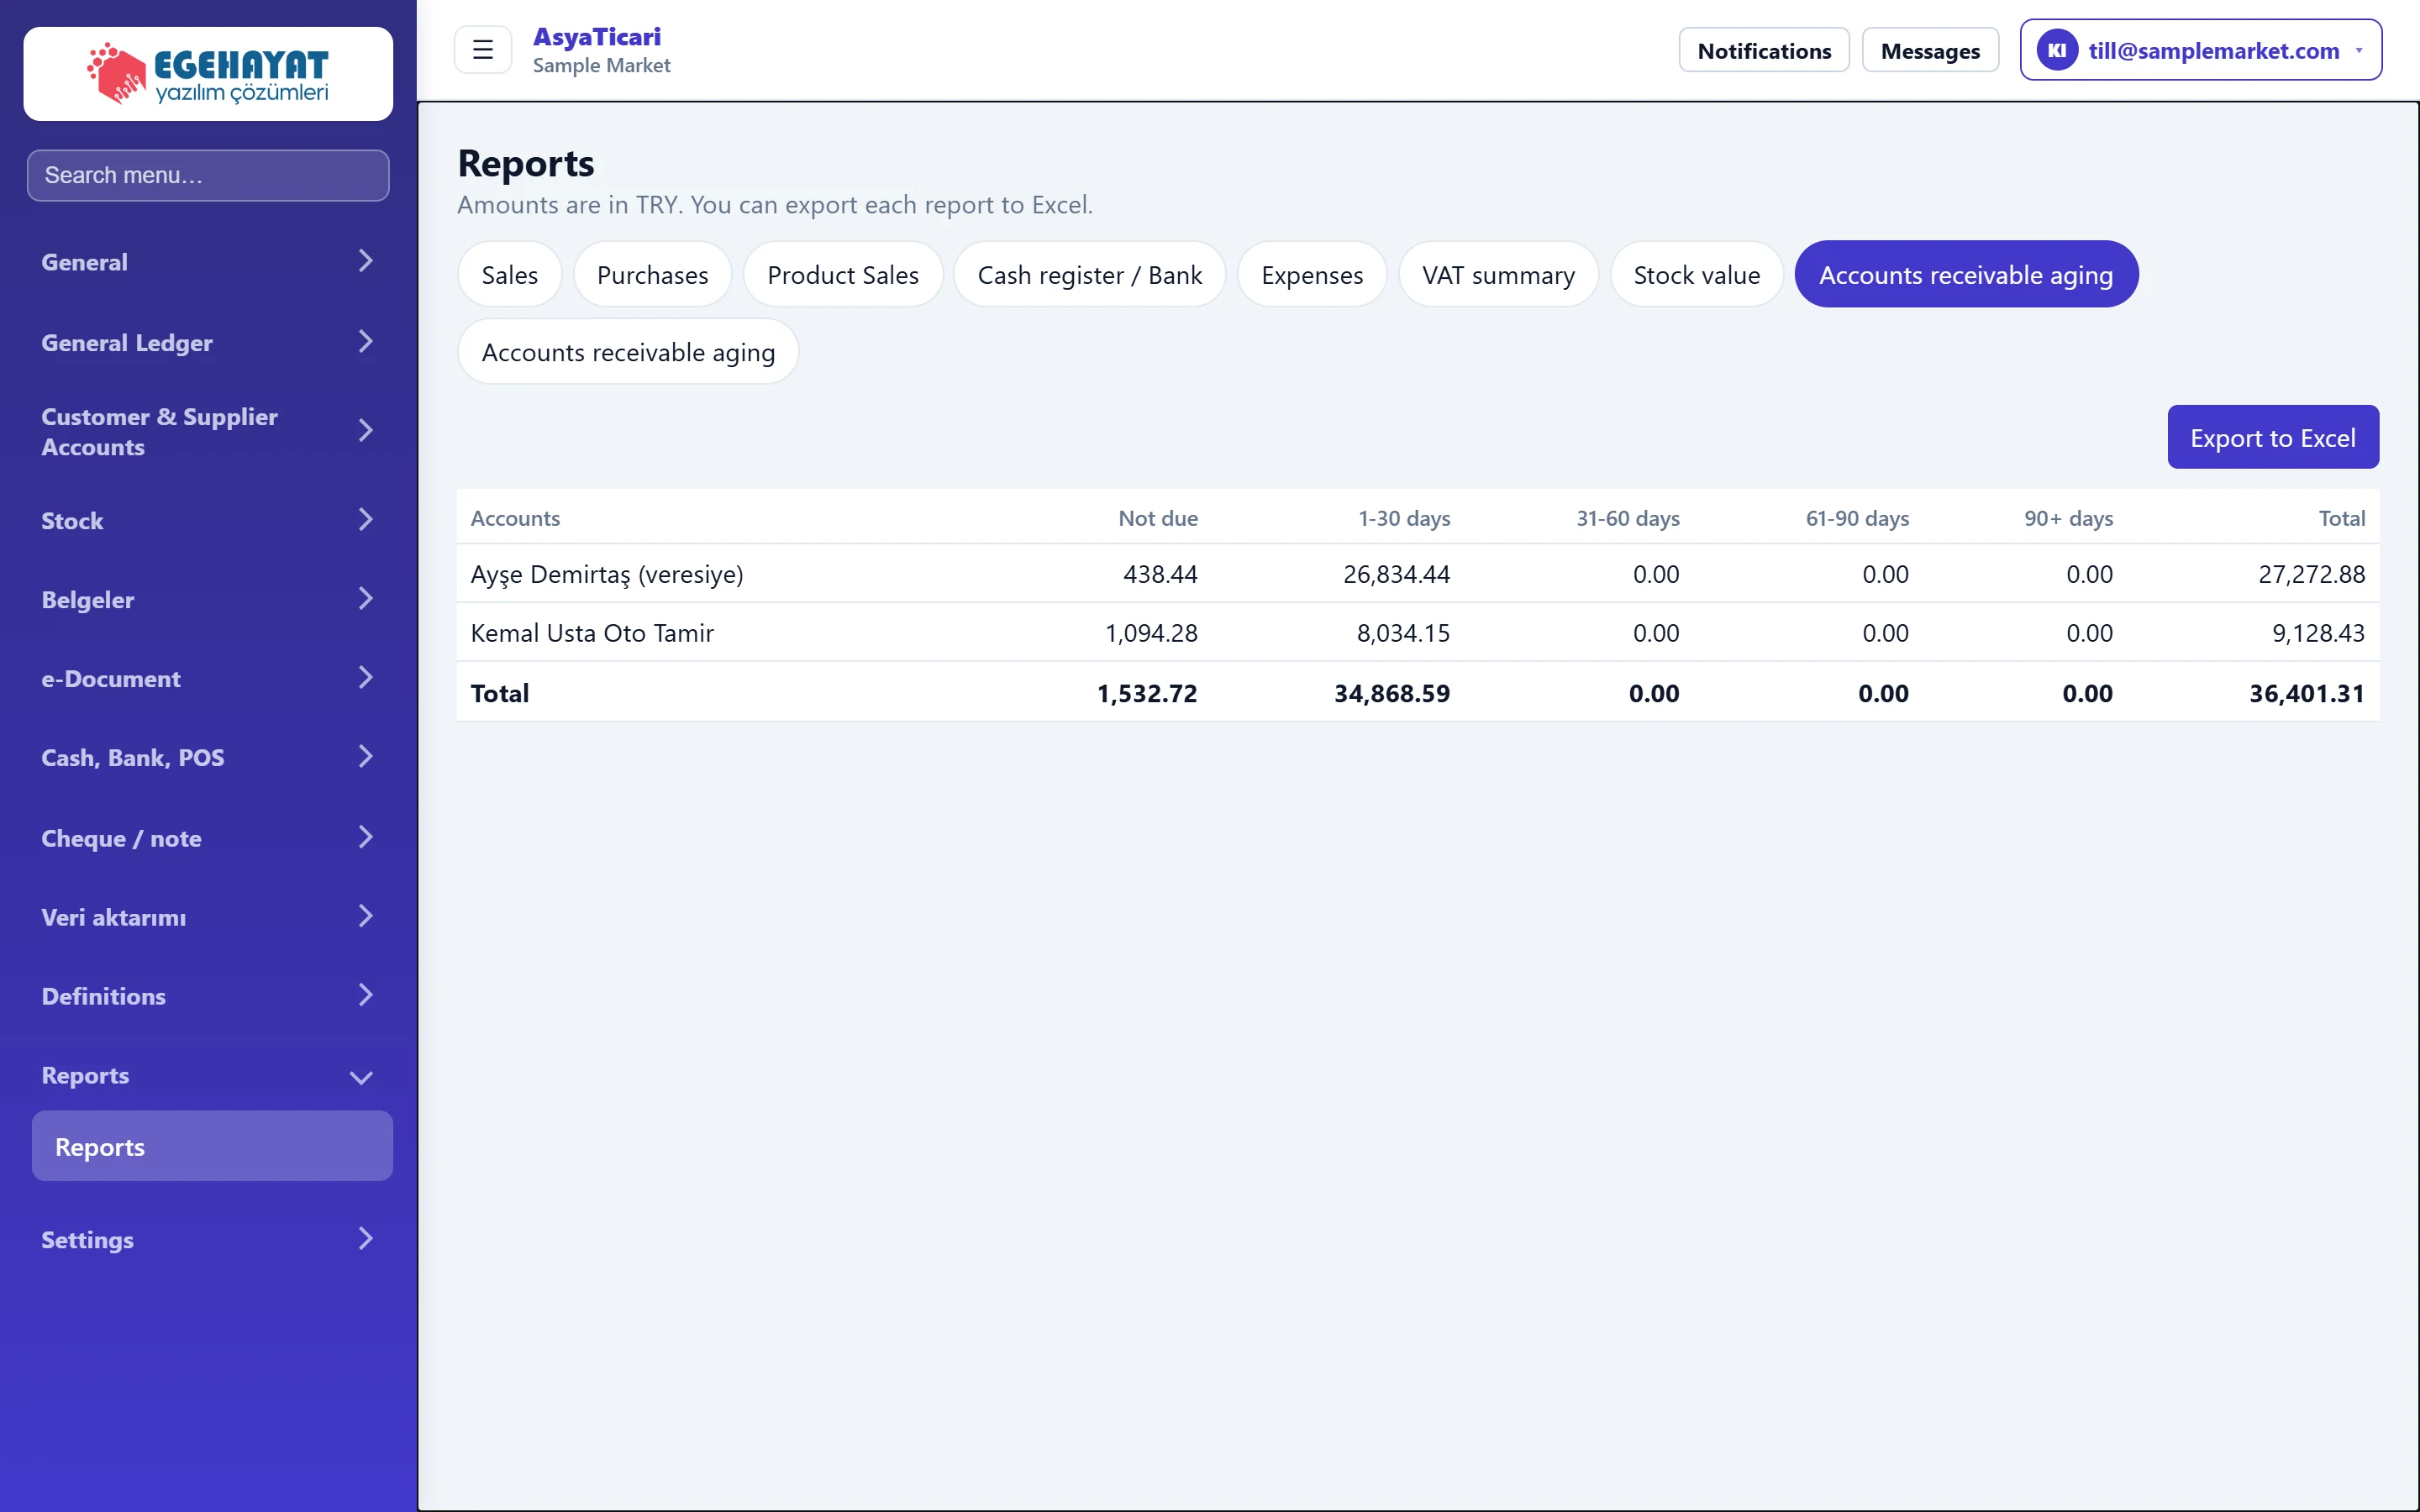
- 1Not yet due Receivables not yet due.
- 2Overdue bands Receivables 1–30 days overdue; further right 31–60, 61–90 and 90+ days.
Give priority to customers with an amount in the 90+ days column; you can remind them by WhatsApp from Ledger → Who owes what. The payables ageing tab shows what you owe suppliers in the same layout.
Stock value
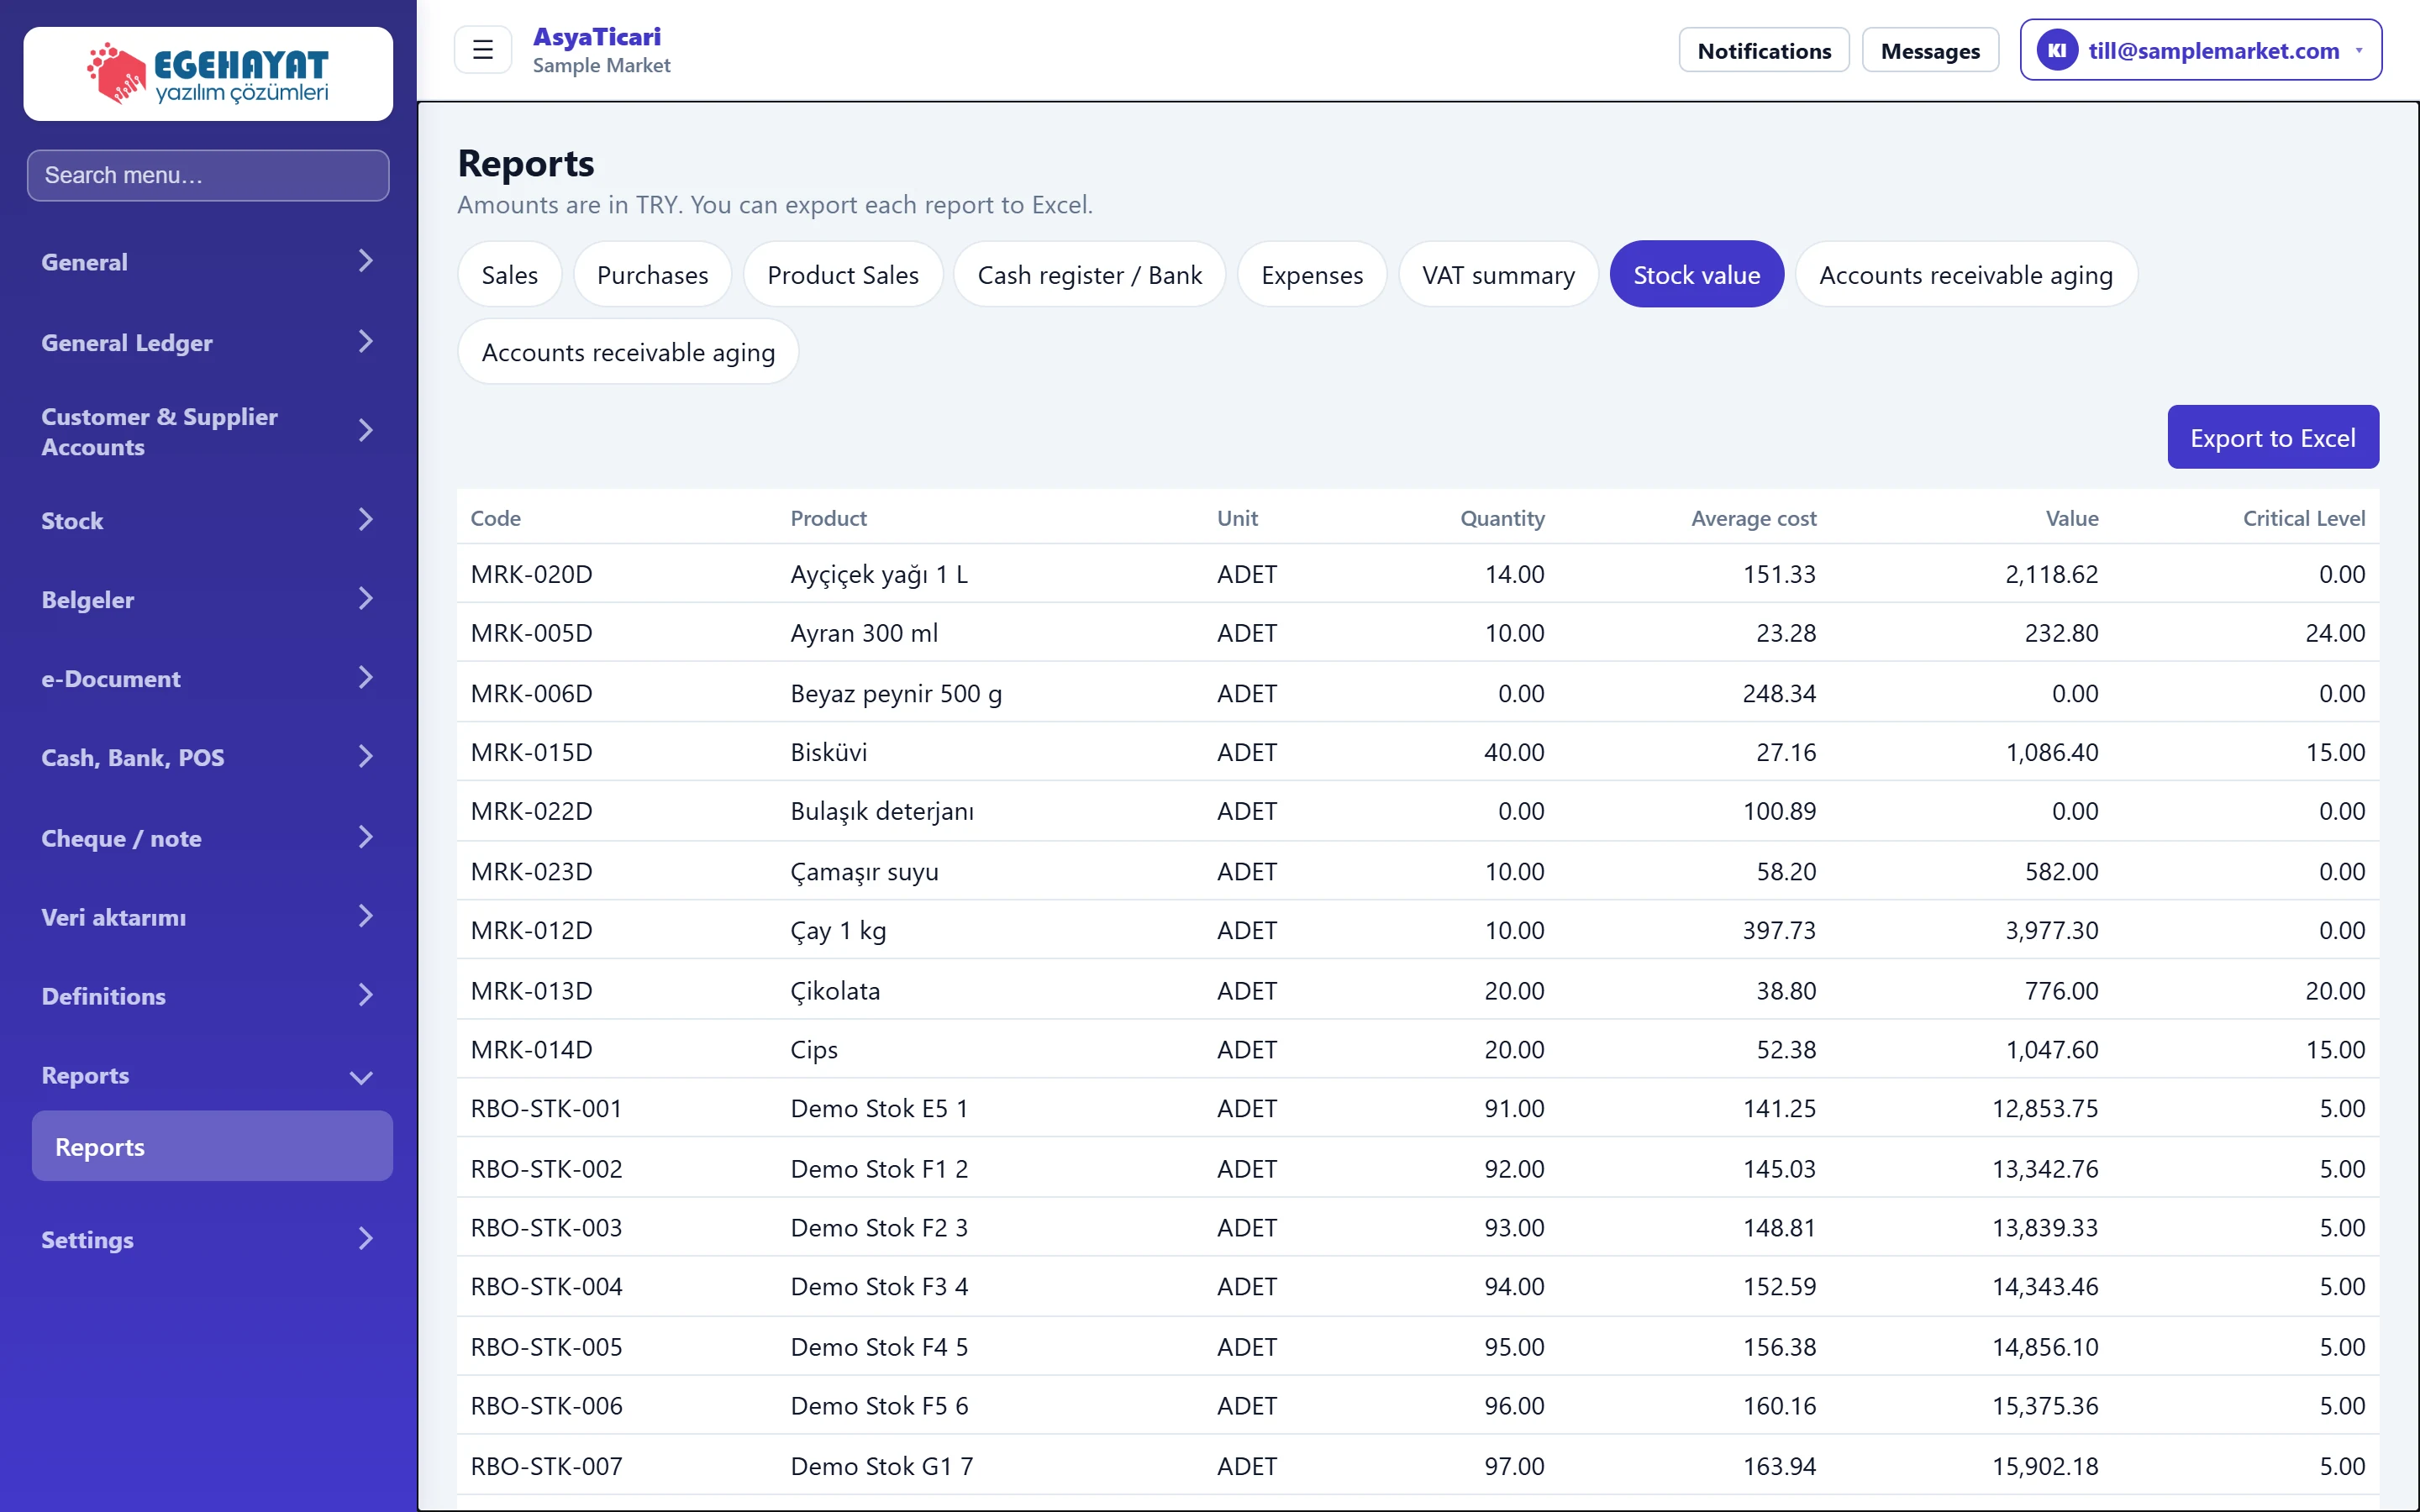
- 1Average cost Weighted average purchase cost.
- 2Value Quantity × average cost.
- 3Critical level Critical level set on the stock card.
Value is quantity times weighted average cost. The critical level is set on the stock card.
Running a report: step by step
- Choose the report in the tabs at the top.
- For reports with a date range, press a preset or type the Start / End date; the report refreshes immediately.
- Check the table and the Total row at the bottom.
- To send it to your accountant, press Export to Excel.
Common messages
| Message | Cause | Solution |
|---|---|---|
| No records for this period. | No records for the report in the selected range. | Choose a longer range (e.g. This month). |